





AI Summary
Key points of this article, generated by AI.
Generating AI Summary
You are interacting with an AI system. AI-generated responses may not always be accurate or complete. Please verify important information before relying on it.
1. Executive Summary
Every technology services contract answers a deceptively simple question: what, exactly, is the client paying for? Whether it is hours, a team, a deliverable, a service level, or a business result, the answer does more to determine both parties’ behavior than any governance meeting or statement of intent.
The commercial model is not paperwork that follows the engineering decisions. It is an engineering decision: an incentive system that, once deployed, runs continuously and shapes what both organizations optimize for.
This paper compares the primary models used in enterprise technology services as well as framework agreements, the contracting vehicle that can wrap any of them. Three conclusions are clearly evident from the analysis.
|
|
|
|
No model is inherently best. |
Each buys a different unit of value, allocates risk differently, and creates a predictable set of incentives, with a characteristic failure mode that appears when it is applied to the wrong kind of work. Research from the University of Tennessee reached the same conclusion after evaluating hundreds of sourcing relationships: Value is destroyed not by choosing a “weak” model, but by mismatching the model to the work or vice versa. |
|
Risk transfer is never free. |
Models that shift delivery risk to the provider price that risk in somewhere. It could be as a visible premium, a contingency buried in an estimate, or rigidity around scope. The real choice is not between “risky” and “safe” models, but between holding risk and managing it, or paying someone else to hold it and verifying they actually do. |
|
The durable answer is a portfolio, not a winner. |
Enterprises that get this right run several models at once and expect each engagement’s model to evolve over its lifecycle. Capacity-based during transition, shifting toward output or outcome-based pricing once baselines are established and results are measurable. |
Because this paper is meant as an objective reference, each model is analyzed with the same discipline, including a section most vendor material omits: Where the economics favor the client, where they favor the provider, and where the two genuinely align. This is candor, not cynicism. It is how each system is designed to behave, and knowing it in advance is what lets both parties build the countermeasures that make any model work.
2. Why Commercial Models Matter in IT Services
An engineer evaluating a distributed system asks how each component behaves under load, what it optimizes for, and where it fails. A commercial model deserves the same analysis, because it is a system: a set of rules that converts effort into money and therefore signals continuously to people on both sides what “good” looks like.
Economists call this the principal–agent problem: Whenever one party engages another to act on its behalf and their information and incentives differ, the agent will drift toward what the contract rewards rather than what the principal intends. This is done rationally, not maliciously. The contract is the objective function, and organizations, like optimizers, converge on it.
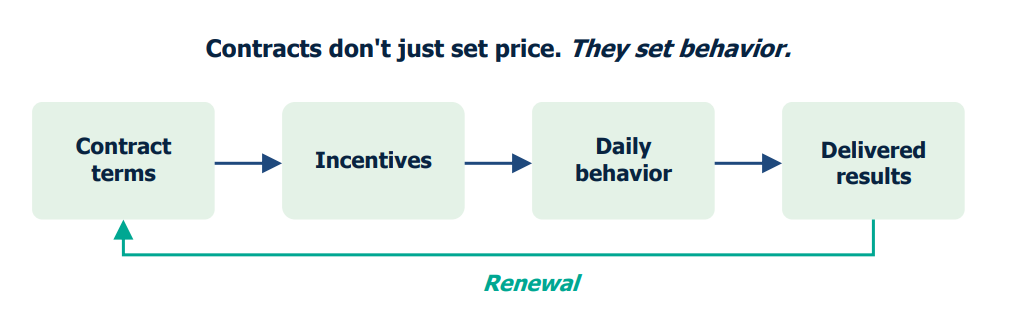
Goodwill cannot compensate for a mis-specified contract, because goodwill operates occasionally while incentives operate every day. Three symptoms are well documented:
- The watermelon scorecard. Every service-level indicator is green on the outside but the business experience is red on the inside. It occurs when a contract pays for what is easy to count (tickets closed, uptime, milestones achieved, etc.) rather than what the business feels, and the provider optimizes the counters.
- The activity trap. Effort-based contracts reward doing work rather than reducing it. A provider paid per hour has no economic reason to automate away the hours; analysts note bluntly that effort-based pricing discourages the very automation clients now expect.
- Change-order economics. Contracts priced against a fixed specification turn every post-signature discovery into a negotiation. The provider’s commercial team is rewarded for policing scope; the client’s engineers experience rigidity when they are learning the most.
None of these indicates a bad partner, only a rational one responding to the system as designed. Two consequences follow. Price-per-unit is the wrong primary lens: the cheapest rate on an effort-based contract can be the most expensive way to buy an outcome; what matters is alignment per dollar. And every model must be judged with its failure mode in view: a model chosen with open eyes outperforms a nobler-sounding one chosen on faith.
3. Commercial Models: What Are You Actually Buying?
The clearest way to organize commercial models is by their unit of purchase, what the invoice is actually denominated in. There are only four:
- Inputs — Hours of effort or FTEs. (T&M, staff augmentation)
- Capacity — The sustained throughput of a stable team. (Fixed Capacity, or PODs)
- Outputs — Deliverables or contracted service levels. (Fixed Price, Managed Services)
- Outcomes — Measurable business results. (Outcome-based, gainshare, vested constructs)
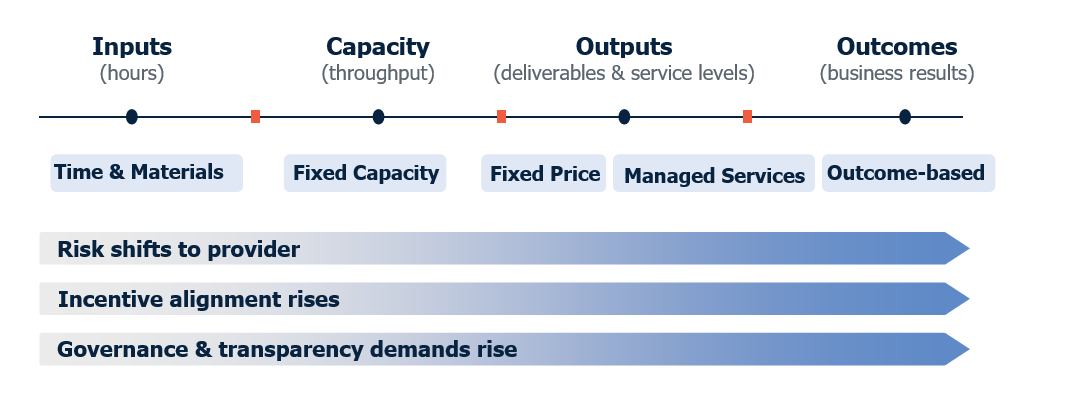
These form a continuum along which three properties change together.
- Risk moves from client to provider: On the left, if the work takes longer the client pays more; moving right, the provider commits to estimates, then service levels, then results.
- Incentive alignment rises, as provider revenue shifts from effort expended to results achieved.
- Governance and transparency demands rise, and many organizations find their measurement and data foundations, not their willingness to sign, are the binding constraint. Three rules govern the continuum.
Risk transfer is never free.
A provider that accepts estimation, operational, or results risk prices it: as an explicit premium, a contingency inside an opaque estimate, or contractual rigidity that protects its downside. This is not improper; it is what accepting risk costs. The practical question is always: Is the premium smaller than the value of the risk I am shedding, and can I verify the risk actually transferred?
Transparency must rise with risk-sharing for the same reason: a client cannot verify a savings commitment, and a provider cannot accept an outcome commitment, without shared facts. Seeking the alignment of the right-hand models without the transparency they require is the single most common way advanced models fail.
A commercial model is two decisions, not one.
University of Tennessee research, building on Oliver Williamson’s Nobel-winning work on transaction cost economics, separates the relationship structure (transactional, relational, or investment-based) from the economic model (paying for transactions, outputs, or outcomes).
Conflating them causes real failures: Outcome economics bolted onto an arm’s-length relationship fail because outcomes need joint planning and shared data, while a relational engagement priced on pure T&M breeds strategic drift.
The work chooses the model.
The right side of the continuum is not “more advanced” as a destination for all work. Three attributes do most of the choosing.
- Requirement certainty — Can the work be specified before it starts, and will the specification hold?
- Measurability and attributability — Can success be stated as an auditable metric, and can the provider’s contribution be isolated from market noise and the client’s own actions?
- Demand variability — Is the volume of work steady, seasonal, or unpredictable?
4. Types of Commercial Models
Each model is analyzed against an identical template, so like can be compared with like.
4.1 Time & Materials / Staff Augmentation Model
|
|
|
|
What it is, and how the provider earns |
The client buys effort (hours of named skills against a rate card, with no commitment to a deliverable or result) worked inside client-directed teams. It remains one of the most prevalent constructs in the industry: HFS survey data put effort-based (FTE) pricing at roughly 42% of buyers’ current commercial-model mix. Margin is billing rate less fully loaded cost, times utilization; revenue grows with headcount and duration, and nothing rewards finishing sooner. Its strengths (flexibility, speed, full client control, easy exit) are real, and for exploratory work it is often the only honest model. |
|
Failure modes |
The client retains essentially all delivery risk while often believing otherwise: The provider is accountable for supplying competent people, not for what they produce. The characteristic failure is the activity trap. Effort is billed whether or not it converges on value. At scale, a second failure mode appears: the hidden management tax. Architecture, prioritization, and integration stay with the client, coordination work that never appears on an invoice. Fragmented estates also diffuse accountability. When twenty suppliers are supplying individuals, none of them owns a result. |
|
Where interests align and diverge |
Both parties want capable people productively engaged, and the provider’s interest in renewal and reference is the model’s only real quality mechanism. Stated plainly, the divergence is time. Provider revenue rises when the work takes longer, so an efficiency gain that saves 1,000 hours costs the provider 1,000 hours of revenue. Choose T&M for flexibility and control, then supply the efficiency pressure yourself, because the contract will not. |
|
What it looks like in practice |
The typical large-enterprise IT estate, with dozens of suppliers and hundreds of augmented contractors, is where the model drifts when it is a default rather than a deliberate choice: line items individually reasonable, the real costs visible only in aggregate. |
4.2 Fixed Price Model
|
|
|
|
What it is, and how the provider earns |
The client buys a defined output for a committed price against an agreed specification and acceptance criteria, paid at milestones. The provider absorbs estimation error: if the work takes more effort than planned, its margin, not the client’s budget, takes the hit. Margin comes from estimating well, delivering efficiently, and pricing risk. Every fixed price contains a contingency invisible to the client. A fourth lever matters more than clients expect: Once the base price is locked, changes are priced without competition, making scope change structurally profitable. |
|
Failure modes |
The model’s integrity rests entirely on the specification: Where requirements are stable it is excellent, and where they are not it punishes learning, since every post-signature insight is a change order. The characteristic failure is rigidity under change: a project that ends “on contract” but off target. A quieter one is quality erosion. A provider losing money on a fixed bid cuts what the acceptance criteria do not test. An underpriced contract is dangerous for both parties, because the provider’s losses become the client’s delivery crisis. |
|
Where interests align and diverge |
Both parties want the specified thing delivered efficiently and accepted on schedule, while the specification holds. Stated plainly: the client pays a risk premium whether or not the risk materializes. On stable work, fixed price is often the more expensive way to buy the same output. The provider profits from scope rigidity and change-order pricing power, against the client’s interest in adapting as it learns. The client cannot see whether the price carried 10% contingency or 40%. The model asks for precise specification, prompt decisions, and change mechanics negotiated as carefully as the base price. |
|
What it looks like in practice |
The UK’s National Programme for IT in the NHS remains the canonical cautionary case. Launched in 2002 to deliver national electronic care records through large, rigid, centrally negotiated fixed contracts, it was dismantled in 2011 with a forecast cost of £9.8 billion. Contracts were signed before requirements were understood, and local users were unbound to nationally fixed specifications, resulting in years of arbitration. Fixed price fails predictably when the specification cannot bear the weight placed on it. |
4.3 Fixed Capacity Model (Pods / Dedicated Product Teams)
|
|
|
|
What it is, and how the provider earns |
The client buys the sustained throughput of a stable, cross-functional team (commonly a pod of five to nine engineers plus embedded quality and DevOps) at a fixed periodic price, working a client-prioritized backlog. The commercial unit is the team-month, which makes this the model most native to agile delivery. Margin is team fee less fully loaded cost, and it widens in two ways worth watching: when the seniority mix drifts below what was priced, and when renewals persist past what the backlog justifies. The defining trade is predictable cost without scope rigidity. |
|
Failure modes |
The client owns productivity risk: The pod costs the same in a sprint that ships ten features and one that ships two, and without honest throughput and quality measurement, capacity degrades into “T&M in team-sized boxes.” A second failure is utilization drift: A fixed team dutifully delivers low-value work if prioritization is weak. Ramp-down is lumpy, and because the fee is fixed, providers have an incentive to thin out the team’s seniority unless the composition is specified. |
|
Where interests align and diverge |
This is one of the naturally better-aligned models: the provider profits from stable, long-tenured teams, precisely what the client wants on its backlog, and because the fee is fixed it gains nothing from work expanding to fill time. Stated plainly, the divergence is that the provider is paid the same whether the team is excellent or merely adequate. The alignment is only as strong as the client’s measurement. The provider also benefits from renewals the client may no longer need; pod counts have a way of becoming permanent. The client’s half of the bargain is a prioritized backlog, visible team metrics, guardrails on composition, and periodic capacity-to-backlog reviews. |
|
What it looks like in practice |
ING’s agile transformation is the best-documented example of the operating model that pods commercialize. Starting in 2015, the bank reorganized roughly 3,500 headquarters staff into about 350 stable, nine-person cross-functional squads, and release frequency moved from five or six per year to every two to three weeks. The contract sets the cost of the team, but the operating model determines what the team is worth. |
4.4 Managed Services Model
|
|
|
|
What it is, and how the provider earns |
The client buys a maintained condition. An ongoing service like application operations, infrastructure, service desk, or security operations is delivered to contracted service levels, with the provider owning the “how” (staffing, tooling, processes, and the automation that does the work). Pricing is a periodic fee, often in service units, frequently with a glide path of committed year-over-year cost reduction. Margin is service fee less cost to run the service, so the provider profits continuously from its own efficiency, compounding across the life of the service. Here, at last, the efficiency incentive points the right way, and accountability consolidates to one owner. |
|
Failure modes |
The same incentive, unmanaged, becomes under-investment: minimum-viable staffing and cost-avoidance on anything the service levels do not test. The canonical failure is the watermelon scorecard, when service levels measure activity rather than experience and business impact. Then boundary rigidity: a provider on a fixed fee has every reason to classify ambiguous requests as out-of-scope change. Finally, innovation stagnation: the glide path commits the provider to cost reduction, not modernization. Exit is among the hardest of any model because the provider’s people, tooling, and process knowledge are the service. |
|
Where interests align and diverge |
On cost and reliability, incentives genuinely converge: the provider profits by making the service cheaper to run, glide paths pass a contracted share of that gain to the client, and incidents now cost the provider money. Stated plainly, three divergences persist. The provider keeps whatever efficiency it achieves beyond its commitments, and closed-book by default it can automate faster than its glide path and bank the difference. Quality converges to the contracted metrics and no further. At renewal, incumbency asymmetry favors the provider, which now knows the true cost of the service while the client does not. The countermeasures are client-side: metrics that measure what the business feels, a thin but senior retained team managing contract and demand, baselining before signature, and benchmarking and exit rights secured while leverage is still balanced. |
|
What it looks like in practice |
Performance-based logistics contracts (managed services by another name) supply the best evidence of the model’s incentive power. The US Navy’s ten-year, $123 million fixed-price performance contract with Raytheon for the H-60 helicopter’s FLIR sensor system paid for availability rather than repairs. Four years in, when it won a performance-based logistics award from the US Department of Defense, the program had sustained 100% availability and improved component reliability by 40%. Reliability engineering had become directly profitable and saved the Navy roughly $31 million. |
4.5 Outcome-Based Models
|
|
|
|
What it is, and how the provider earns |
The client buys a business result (costs reduced against a baseline, revenue increased, fraud prevented, cases resolved) with compensation tied, in whole or part, to measured achievement. The family spans performance bonuses and penalties layered on another model; gainshare/painshare, splitting value above a baseline by formula; pay-per-outcome fees on result units; and vested constructs with low guaranteed and high incentive margins. Margin is the gap between the value-linked fee and the cost of the result, which makes this the fullest alignment available. The provider applies a premium to the price because it carries results risk. Any provider that accepts outcome risk without pricing it is a red flag, not a bargain. |
|
Failure modes |
Everything rests on three prerequisites. Measurability: The outcome must be objective, auditable, and cheap enough to measure that measurement does not consume the value. Attributability: The provider’s contribution must be isolable from market movements, client actions, and luck; where attribution is contested, the model degenerates into dispute. Baseline integrity: Gainshare against a soft baseline manufactures fictitious savings, and both parties are tempted: the client to harden the baseline after the fact, the provider to soften it before. Beyond these, “sandbagging” converts the model into fixed price wearing a costume, and where the client constrains the “how,” the risk transfer quietly reverses. |
|
Where interests align and diverge |
At its best, provider growth is arithmetically coupled to the client’s measured benefit. Stated plainly, the divergence concentrates in three places. Definition: The provider wants a narrow, controllable, conservatively baselined outcome and the client a broad, ambitious one, so the negotiation of the outcome definition is the deal, and asymmetries locked in there compound silently for years. The premium: Where the provider is better informed about the probability of success, the price of risk transfer can be systematically overpriced. Selective scope: Providers steer these constructs toward the most automatable slices, leaving the client the difficult residue. All three are manageable, but only in the open. The model asks more of the client than any other: agreed baselines, outcome definitions written with the precision of an engineering specification, genuine transfer of method authority, and funded joint governance. |
|
What it looks like in practice |
Two cases bracket the range. Rolls-Royce’s “Power by the Hour” originated in 1962 and was industrialized as TotalCare in the late 1990s. It sells aircraft engine performance rather than engines and repairs: airlines pay per engine flying hour, roughly 90% of the Trent fleet flies under such agreements, and every reliability investment converts directly into margin. Microsoft–Accenture “OneFinance” shows the construct in enterprise services: a finance-operations agreement across 96 countries, signed in 2007 at $185 million over seven years on vested principles. Results include consolidation from 140 finance systems to fewer than 40, service levels above 99.5%, 18% productivity gains plus $63 million in additional savings in the early years, and extensions through 2018. |
5. Framework Agreements: The Wrapper, Not the Model
A framework agreement is a contracting vehicle, not an economic model. It does not decide what the client pays for; it decides how quickly engagements can be initiated. Every model in Section 4 can live inside one, and a well-built framework hosts several at once, buying speed, terms negotiated once at portfolio leverage, and panel competition per call-off.
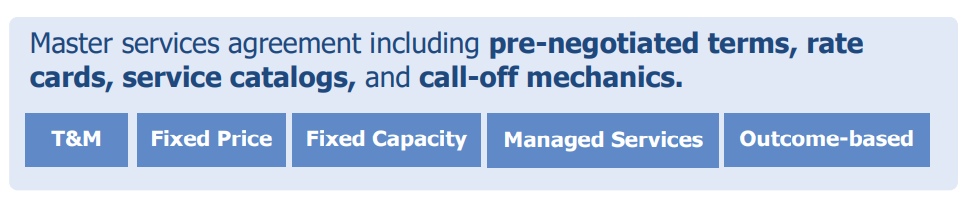
An important caveat worth mentioning is that frameworks have a characteristic failure mode of their own: a rate-card framework quietly defaults every engagement to T&M economics. The rate card is the path of least resistance, and each call-off that simply draws named roles against it reproduces staff augmentation, whatever the intent the framework was signed with. The remedy is structural: Build it as a menu of models, pre-agreeing on pod price structures, managed-service constructs with reference service levels and glide-path mechanics, and gainshare formulas, so the aligned models are as frictionless to call off as the rate card.
6. Comparing Commercial Models
Framework agreements are omitted deliberately: as a contracting vehicle, they can wrap any column. Read vertically, each column is a coherent system — risk position, margin sources, and perverse incentive are one design. Read horizontally, the rows expose the trade-offs: no column dominates, and several show the price of the alignment the right-hand columns offer.
|
|
T&M / Staff Aug. |
Fixed Price |
Fixed Capacity |
Managed Services |
Outcome-Based |
|
Unit of value |
Hours / FTEs |
Defined deliverable |
Team throughput (team-month) |
Service levels maintained |
Measured business result |
|
Scope risk |
Client |
Provider (within spec); client (spec changes) |
Client (via backlog) |
Shared at service boundary |
Provider (within outcome definition) |
|
Delivery / estimation risk |
Client |
Provider |
Provider (team supply) Client (productivity) |
Provider |
Provider |
|
Demand risk |
Minimal — pay per use; provider carries bench |
N/A (fixed scope) |
Client (fixed team cost) |
Mostly provider; per-unit variants share |
Shared via baseline |
|
Cost predictability |
Low |
High (per scope) |
High |
High, with committed reductions |
Variable by design (tracks value) |
|
Flexibility to change |
Highest |
Lowest |
High (reprioritize freely) |
Low at service boundary |
Medium (outcome fixed, method free) |
|
Incentive alignment |
Lowest |
Medium, while spec holds |
Medium-high, if measured |
High on cost & reliability |
Highest, if measurable |
|
Characteristic perverse incentive |
More hours = more revenue |
Change-order economics; quality cut to spec |
Adequate ≠ excellent; capacity persists |
Under-investment; watermelon SLAs |
Sandbagged targets; baseline gaming |
|
Provider margin source |
Rate − cost, × utilization |
Price − cost; risk premium; change orders |
Team fee − cost; tenure & stability |
Efficiency beyond commitments; scale |
Share of value created; risk premium |
|
Transparency needed |
Low (closed book) |
Low-medium |
Medium (team metrics) |
Medium-high (benchmarking rights) |
High (open/shared book, joint baselines) |
|
Requirement certainty needed |
None |
High |
Low (backlog-level) |
Medium (stable service definition) |
Medium (outcome, not method) |
|
Client governance burden |
High (directs all work) |
Medium (spec & acceptance) |
Medium (backlog & metrics) |
Low-medium (contract & demand mgmt.) |
High (baselines, measurement, joint boards) |
|
Speed to mobilize |
Days |
Weeks-months (spec first) |
Weeks |
Months (transition) |
Months (baseline & negotiation) |
|
Innovation incentive for provider |
None (revenue-negative) |
Within scope only |
Indirect (via renewal) |
Strong on cost; weak past SLAs |
Strongest (any better method pays) |
|
Exit difficulty |
Low |
Low (at milestones) |
Medium (knowledge in teams) |
High (provider runs the operation) |
High (entangled baselines & data) |
|
Typical best fit |
Discovery, spikes, ramp-up |
Stable, well-specified builds |
Continuous product development |
Steady-state operations at scale |
Instrumented processes with clean baselines |
7. How to Choose the Right Model
In most cases, model selection can be reduced to three questions about the work:
- How certain are the requirements? High certainty unlocks output-based models like fixed price and managed services once the service is stable. Low certainty demands input- or capacity-based buying, because committing to outputs against guesswork buys risk transfer that will not survive.
- How measurable (and attributable) is the result? If success can be stated as an auditable metric the provider substantially controls, outcome constructs open up; if only partially, use incentive overlays; if not at all, instrument first.
- How variable is the demand? Steady flow suits standing constructs; spiky demand favors per-use buying or flexible-capacity hybrids.
Across a portfolio, those questions sort engagements into four archetypes:
- Run: Steady-state services like application and infrastructure operations, service desks, security operations. Their natural home is managed services, with a productivity glide path, experience-grade metrics, and contracted benchmarking, evolving toward outcome overlays as baselines mature.
- Build: Defined delivery like migrations, implementations, and regulatory programs with knowable scope. Their natural home is fixed price, with disciplined acceptance criteria, where discovery is expected, fixed price per increment or a delivery pod rather than a monolithic bid.
- Transform: Multi-year change such as operating-model change, platform re-architecture, or delivery transitions. These have a high learning rate, evolving scope, and results are measurable only as the program matures. Their natural home is a sequenced portfolio: T&M or small pods for discovery, fixed capacity as the chassis while teams stabilize and knowledge transfers, then managed services for what becomes steady-state and outcome constructs for what becomes measurable. The commercial model matures with the program, which is the most important and least practiced idea in this paper.
- Explore: Proofs of concept like technology evaluation, feasibility spikes, and early AI pilots. Their natural home is T&M or a small, time-boxed pod with explicit graduation criteria.
Three portfolio principles complete the framework.
|
|
|
|
Run a portfolio deliberately |
The failure pattern is not mixing models but mixing them by accident, with each engagement inheriting whatever construct its procurement path defaulted to. |
|
Let engagements graduate |
Contracting the criteria up front (e.g. “Per-unit pricing begins when we have two quarters of stable baseline data”) converts a partnership aspiration into a schedule. |
|
Buy alignment where it pays for itself |
Advanced models carry real overhead. University of Tennessee research found that applying a vested construct where a simpler preferred-provider arrangement fits destroys value with governance the relationship cannot amortize. |
8. Emerging Models: Consumption-Based and Outcome-Based Commercial Models for AI
Generative and agentic AI are not adding another model to the list. They are stressing the assumption underneath the traditional models: that effort is a reasonable proxy for value.
When software performs a material share of delivery, selling hours prices the wrong thing: a provider that automates a workflow under an effort-based contract cuts its revenue in proportion to its success. Analysts describe the resulting shift as the pivot from headcount-based services to “services-as-software.” Services productized as platforms and agents are priced like software: by consumption, by subscription, or by outcome.
The direction of travel is well documented: Across 2025–2026 industry surveys, buyers expect FTE-based pricing to fall from roughly 42% to 28% of their commercial-model mix within three years, with outcome-based constructs nearly doubling from roughly 20% to 39%. The practitioner data counsels caution, however. According to a 2026 HFS study, outcome-based pricing governed only about 5% of deals, despite 76% of buyers professing openness to it. Clearly, the appetite is far ahead of the measurement discipline required to execute.
Three emerging constructs are worth understanding:
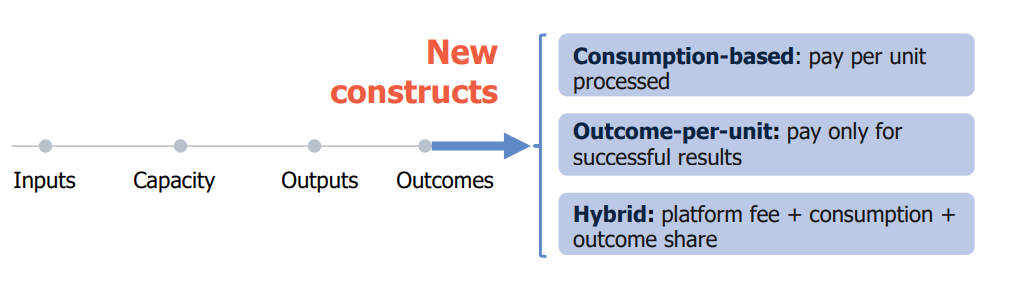
- Consumption pricing charges per unit consumed, such as transactions processed, documents extracted, or agent-hours. It aligns cost to usage but carries budget unpredictability and the efficiency penalty: As usage is optimized, spending falls. The better the product performs, the less it earns.
- Outcome-per-unit pricing is the AI-native construct. Fees are attached to successful results only: per case resolved without human intervention, per invoice straight-through-processed, per fraud attempt blocked. Contract-accounting guidance for agentic AI now formalizes these archetypes and insists that success criteria be contractually clear, objective, and measurable.
- Hybrid platform models are converging fastest in practice. A fixed platform fee funds the standing capability, a consumption component scales with usage, plus an outcome kicker shares measured value. It delivers a bounded downside, an aligned upside, and complexity in stages.
These models sit at the outcome end of the continuum and inherit its prerequisites, along with an additional one: unit-economics literacy. Whoever misprices the unit absorbs the error at machine speed and contract scale, so early agreements should be small, heavily instrumented, and designed for re-pricing — with staged commitments, volume collars, and scheduled unit-price reviews.
9. How to Make Any Commercial Model Work
Model selection is perhaps a third of the result. The remainder is operating discipline, strikingly consistent across models.
- Baseline before you transfer risk. Un-baselined risk transfer is fictional. Risk returns as change orders, glide-path disputes, or gainshare arguments. The baseline is part of the model’s cost.
- Measure what the business feels. The design test for every metric is: If the provider optimized this number ruthlessly and exclusively, would we be happy? If not, it needs a counterweight.
- Design the change mechanism for use, not deterrence. If the joint that flexes in response to change is punitive or slow, the parties stop using it and the contract detaches from reality.
- Match transparency to risk-sharing. The party accepting risk needs the data to price it. The one paying a premium needs the data to verify it.
- Negotiate the exit while the relationship is healthy. Credible exit terms like transition assistance, knowledge escrow, and re-competition rights improve daily behavior. These cost little at signature, but are nearly unbuyable at termination.
- Bring the client’s half of the bargain. Every model makes demands on the buyer, yet sourcing research repeatedly finds that “provider failures” trace to the client-side of the equation being unstaffed.
10. Conclusion
The commercial model is the most consequential engineering decision in a services relationship, even though it is usually not treated as one. Each construct on the continuum from hours to outcomes is a coherent system with a known risk position, a known margin mechanism, and a known failure mode. Each behaves as designed, whether its owner understands the design or not.
Three disciplines separate organizations that get durable value from these models. They buy alignment deliberately, matching the model to the work rather than defaulting to habit or rate-card gravity. They instrument what they buy, because every model is only as aligned as its measurement is honest. And, they let the portfolio evolve, graduating engagements towards outcome-based constructs as baselines mature, at the pace the evidence supports.
In the end, the underlying truth is that a commercial construct is not a document to be signed, but a system to be operated.
